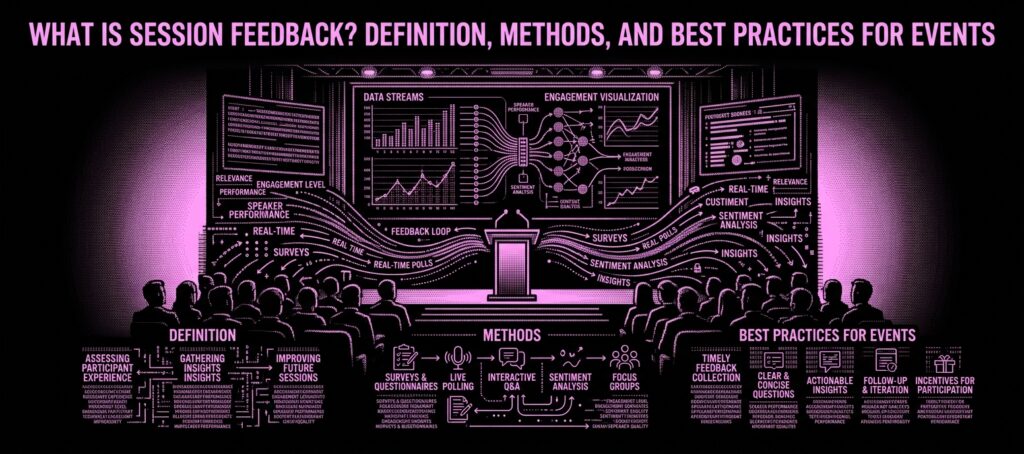
Session feedback is the structured collection of attendee evaluations, ratings, and comments about individual sessions at a conference, summit, or event. It captures how attendees perceive session quality, speaker effectiveness, content relevance, and practical applicability, providing event organizers with the data needed to improve future programming, demonstrate value to stakeholders, and make informed decisions about speaker selection and topic curation.
Unlike general event feedback, which assesses the overall experience, session feedback is granular. It tells you which specific sessions delivered value and which fell short, which speakers resonated and which lost the room, and which topics your audience wants more of. For multi-track conferences, session feedback is the primary tool for understanding what happened in the rooms your team was not in.
Key benchmarks: Post-event survey response rates average just 10-20% for conferences. Feedback collected within two hours of a session scores 40% higher on actionability than delayed surveys. In-person collection at events can achieve 85-95% completion rates compared to 20-30% for email follow-ups.
This guide covers how session feedback works, the methods and technology available, what it costs, how to increase response rates, and how to turn raw feedback into programming decisions.
Session Feedback Defined
Session feedback encompasses any structured data collection that evaluates individual sessions within a larger event. It typically includes three components.
Quantitative ratings. Numerical scores on dimensions like content quality, speaker effectiveness, session pacing, and practical relevance. These are usually collected on 1-5 or 1-10 scales and allow for comparison across sessions, speakers, and events over time.
Qualitative comments. Open-ended text responses where attendees describe what worked, what did not, and what they would change. These provide the context behind the numbers and surface insights that rating scales cannot capture.
Behavioral signals. Data derived from attendee actions rather than explicit feedback: session attendance duration, early departures, app engagement during the session, questions asked, and social media mentions. These provide feedback even from attendees who do not complete surveys.
The most effective session feedback programs combine all three, using ratings for benchmarking, comments for insight, and behavioral data for validation.
How Session Feedback Works
Collection Methods
Post-session surveys. The most common method. Attendees receive a short survey (3-7 questions) immediately after or within hours of attending a session. Delivered via email, event app notification, or QR code displayed on the final slide.
In-session polling. Real-time feedback collected during the session using audience response systems or event apps. Attendees rate content, ask questions, and indicate engagement levels while the session is happening.
QR code feedback. A QR code displayed on screens or printed materials links to a brief survey (1-3 questions). Attendees scan and respond immediately, typically achieving higher completion rates than email surveys because of the reduced friction.
Kiosk stations. Physical feedback stations at room exits where attendees tap a rating (happy face, neutral face, sad face) as they leave. These capture high-volume, low-depth feedback and are most useful for monitoring trends across many sessions.
Event app ratings. Built into the event’s mobile app, allowing attendees to rate sessions with a single tap as they review the agenda or schedule. Low friction, but often produces biased results (attendees who liked a session are more likely to rate it).
AI-derived feedback. Emerging approach where AI analyzes session content, audience engagement signals, Q&A activity, and sentiment to generate feedback insights without requiring explicit attendee input.
Timing Matters
Research consistently shows that timing is the strongest predictor of both response rate and response quality.
- During the session (live polls): Highest engagement, but limited to simple questions. Does not capture overall session assessment.
- Immediately after (0-15 minutes): Highest response rates for post-session surveys (40-60% with in-app push notifications). Captures emotional response and fresh impressions.
- Same day (1-4 hours): Good response rates (20-40%). Allows for more reflective feedback. The Event Marketing Institute found this window produces the most actionable insights.
- Next day or later: Response rates drop to 10-20%. Memory fades, emotional response diminishes, and competing priorities reduce completion.
- Post-event bulk survey (days later): Lowest response rates (5-15%). Attendees struggle to recall individual sessions. Produces generic rather than session-specific feedback.
The pattern is clear. Every hour of delay between session end and survey delivery reduces both response rate and feedback quality. The organizations achieving the best feedback data collect it within minutes of session completion.
Session Feedback for Events: Why It Matters
Programming decisions
Session feedback is the primary input for next year’s programming. Without it, content committees are guessing. Which topics should return? Which speakers should be invited back? Which session formats (panel, workshop, keynote, fireside chat) generated the most value? Session feedback transforms these from opinion-based debates into data-informed decisions.
Speaker development
Constructive session feedback helps speakers improve. Many conferences share aggregated feedback (not individual comments) with speakers, helping them refine their presentations, pacing, and audience interaction. The best speaker programs tie feedback scores to future speaking invitations.
Stakeholder reporting
For associations, session feedback demonstrates member value. For corporate events, it demonstrates ROI. For sponsored sessions, it provides data to justify sponsor investment. CEOs, boards, and CMOs want evidence that the event delivered learning outcomes, and session feedback is that evidence.
Attendee retention
Events that act on session feedback, and visibly communicate that they have done so, see higher return attendance. When attendees see “You told us you wanted more hands-on workshops. This year, 40% of sessions are workshop format,” they feel heard and are more likely to register again.
Types of Session Feedback Approaches
- Structured surveys (quantitative + qualitative). The traditional approach. Pre-defined questions with rating scales and open-text fields. Best for benchmarking and trend analysis across events. Typical cost: $0-$5,000 depending on survey platform.
- Net Promoter Score (NPS) per session. A single question: “How likely are you to recommend this session to a colleague?” Scores from 0-10, categorized as Promoters (9-10), Passives (7-8), and Detractors (0-6). Simple, benchmarkable, but lacks diagnostic depth.
- Real-time audience response. Live polling during sessions using platforms like Slido, Mentimeter, or Poll Everywhere. Captures engagement in the moment. Cost: $100-$500 per event for basic plans.
- Sentiment analysis. AI-powered analysis of session chat, social media mentions, and Q&A content to gauge audience reaction without explicit surveys. Emerging approach with growing accuracy.
- Exit feedback (kiosk/tap ratings). Physical or digital “rate as you leave” systems. High participation, low depth. Best as a supplement to surveys, not a replacement.
Session Feedback Costs and Pricing
- Event app with built-in feedback: $1,000-$10,000 per event (Whova, EventMobi, Cvent). Feedback is typically included in the app platform cost.
- Standalone survey tools: $0-$500 per event (Typeform, SurveyMonkey, Google Forms). Free tiers available for basic needs.
- Audience response platforms: $100-$1,500 per event (Slido, Mentimeter, Poll Everywhere). Pricing typically based on audience size.
- Kiosk/exit feedback hardware: $200-$1,000 per device rental, or $500-$2,000 to purchase.
- AI-powered feedback analysis: $500-$5,000 per event depending on session volume and analysis depth.
- Full-service feedback program (design + analysis + reporting): $5,000-$25,000 for large conferences using external research firms.
For most mid-size conferences (500-2,000 attendees), session feedback costs $2,000-$8,000 when using an event app with built-in survey capabilities. This is less than 1% of a typical event budget for data that directly shapes next year’s programming and justifies the event’s existence to leadership.
How to Increase Session Feedback Response Rates
- Reduce friction. Keep surveys to 3-5 questions maximum. Every additional question reduces completion rates by approximately 5-10%.
- Deliver immediately. Push the survey notification within 5 minutes of session end. Use the event app’s scheduling feature to automate this.
- Make it visible. Display a QR code on the speaker’s final slide. Ask the speaker to verbally encourage feedback. “Your feedback shapes next year’s program” is more motivating than “please fill out the survey.”
- Gamify participation. Award app points or leaderboard credit for completing session evaluations. Whova and similar platforms report 2-3x response rate improvements when gamification is enabled.
- Close the loop. During the event, share a statistic from feedback already collected. “Yesterday’s keynote received a 4.7 out of 5 from 320 respondents” signals that feedback matters and is being read.
Session Feedback vs. Event Feedback
Session Feedback
Evaluates individual sessions: speaker quality, content relevance, format effectiveness, and learning outcomes. Granular, session-specific, and primarily useful for programming decisions.
Event Feedback
Evaluates the overall experience: venue quality, food and beverage, networking opportunities, registration process, and general satisfaction. Holistic and primarily useful for logistics and experience design.
The mistake many events make is combining both into a single post-event survey. This creates a long survey that depresses response rates and conflates session-level and event-level data. The better approach is to collect session feedback individually (via the event app, immediately after each session) and event feedback separately (via a short overall survey on the last day or within 24 hours of the event close).
Session Feedback and Event Technology
Technology has fundamentally changed what session feedback can capture and how quickly it can be acted upon.
Event apps have made per-session feedback collection standard. Instead of a single post-event survey asking attendees to recall 12 sessions, apps push micro-surveys after each session, collecting fresher, more accurate data.
AI-powered content analysis is creating a new category of feedback that does not depend on attendee responses at all. By analyzing session content, Q&A patterns, audience engagement signals, and social mentions, platforms can assess session impact even from the 80% of attendees who never complete a survey.
Snapsight’s approach to session intelligence goes beyond traditional feedback. By capturing and processing the actual content of every session across an event, Snapsight can identify which sessions generated the most audience questions, which topics sparked cross-session discussion, and which themes emerged as unexpected priorities. This content-level analysis provides programming insights that rating scales miss: not just “was the session good?” but “what specifically resonated, and how does it connect to what other sessions covered?”
With 10,415+ sessions processed, this approach has revealed patterns that traditional feedback alone cannot capture, like when a breakout session’s most valuable content contradicts the keynote, or when three different sessions in different tracks converge on the same emerging challenge.
For post-session surveys delivered via an event app, 20-30% is typical and 40%+ is excellent. For email surveys sent after the event, 10-15% is common. In-person collection methods like QR codes and kiosk stations can achieve 50-85%. The key factors are timing (immediately after the session), length (3-5 questions maximum), and visibility (speaker encouragement and displayed QR codes). Gamification through event app leaderboards can boost rates by 2-3x.
Three to five questions is the sweet spot. Include one overall rating question (1-5 scale), one or two specific dimension questions (speaker effectiveness, content relevance), and one open-text question for comments. Surveys with more than seven questions see significantly lower completion rates. If you need more detailed data, rotate additional questions across sessions so no single survey is too long.
Yes, with caveats. Anonymous feedback generates more honest responses, particularly for negative feedback that attendees might withhold if identified. However, completely anonymous feedback prevents follow-up and makes it impossible to correlate feedback with attendee demographics or behavior. The best practice is to collect feedback through the event app (which can link responses to profiles internally) but communicate to attendees that individual responses will not be shared with speakers or sponsors. Share only aggregated data externally.
Negative feedback is the most valuable feedback. Resist the urge to dismiss it or explain it away. First, look for patterns: if multiple attendees flag the same issue (too technical, too basic, poor pacing), it is a real problem regardless of the overall score. Second, separate actionable feedback from personal preference. “The speaker read from slides” is actionable; “I prefer different topics” is preference. Third, share aggregated negative feedback constructively with speakers, framing it as improvement opportunity. Fourth, use negative feedback to adjust future programming by identifying topic gaps, format mismatches, or audience-speaker alignment issues.
AI-powered content analysis can supplement but not replace direct attendee feedback. AI can analyze session engagement signals, Q&A patterns, social media sentiment, and content themes, providing insights even when survey response rates are low. However, AI cannot capture attendee intent, satisfaction, or specific improvement suggestions. The most effective approach combines traditional surveys (for direct attendee voice) with AI analysis (for behavioral and content-level insights), giving event planners both what attendees say they think and what their behavior reveals.